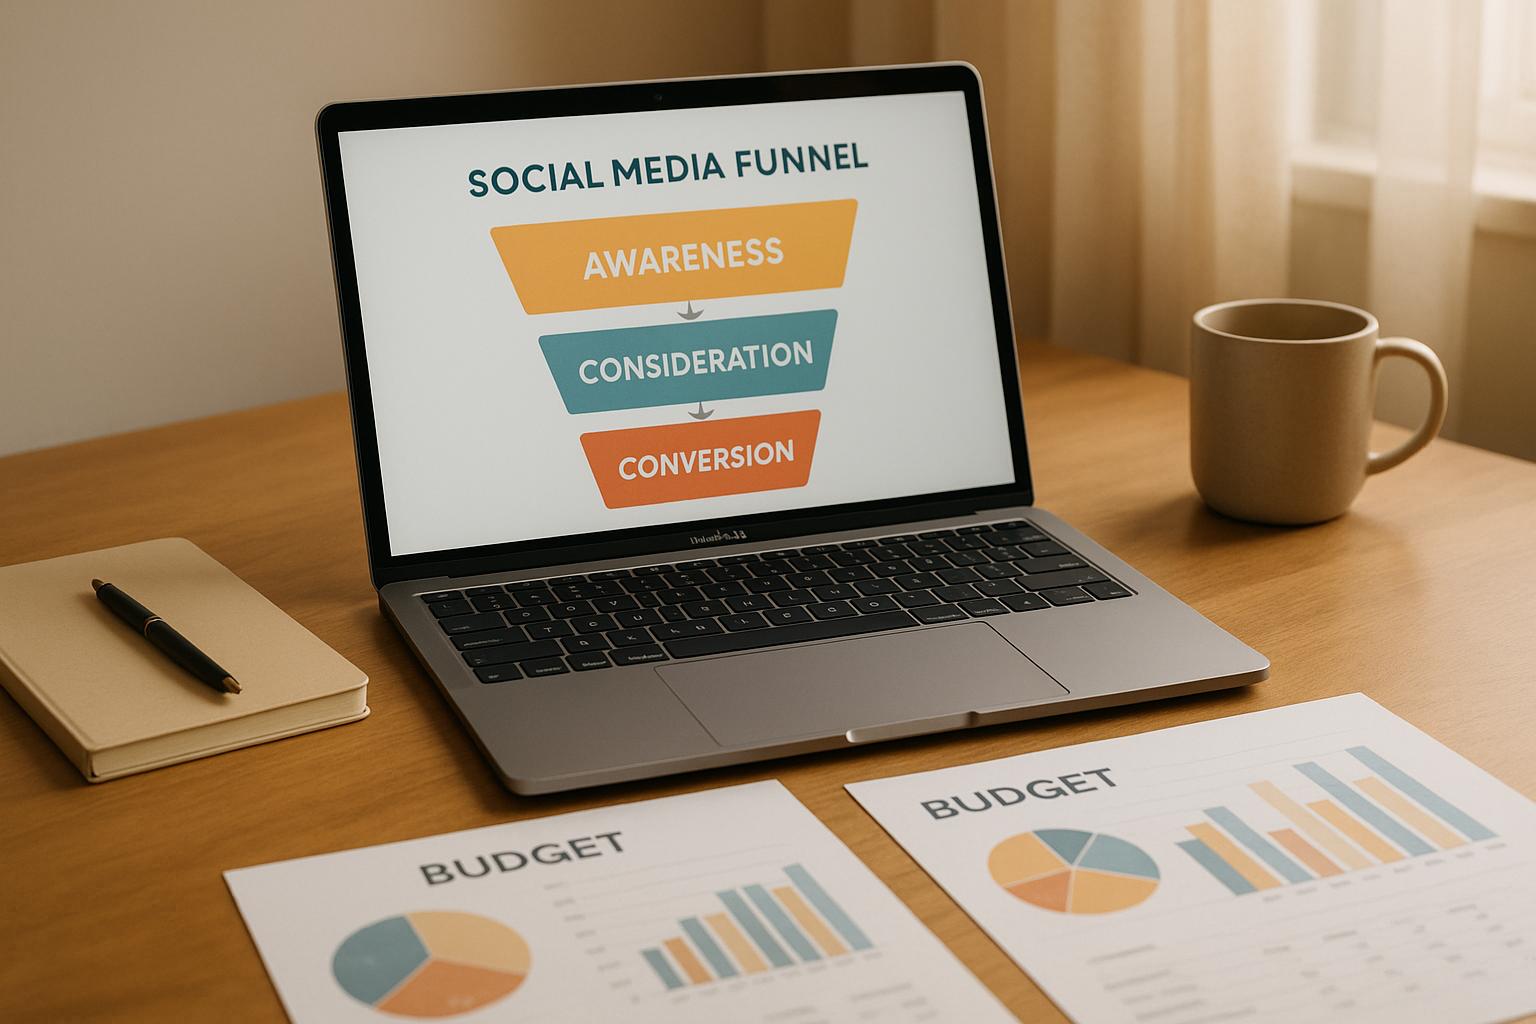
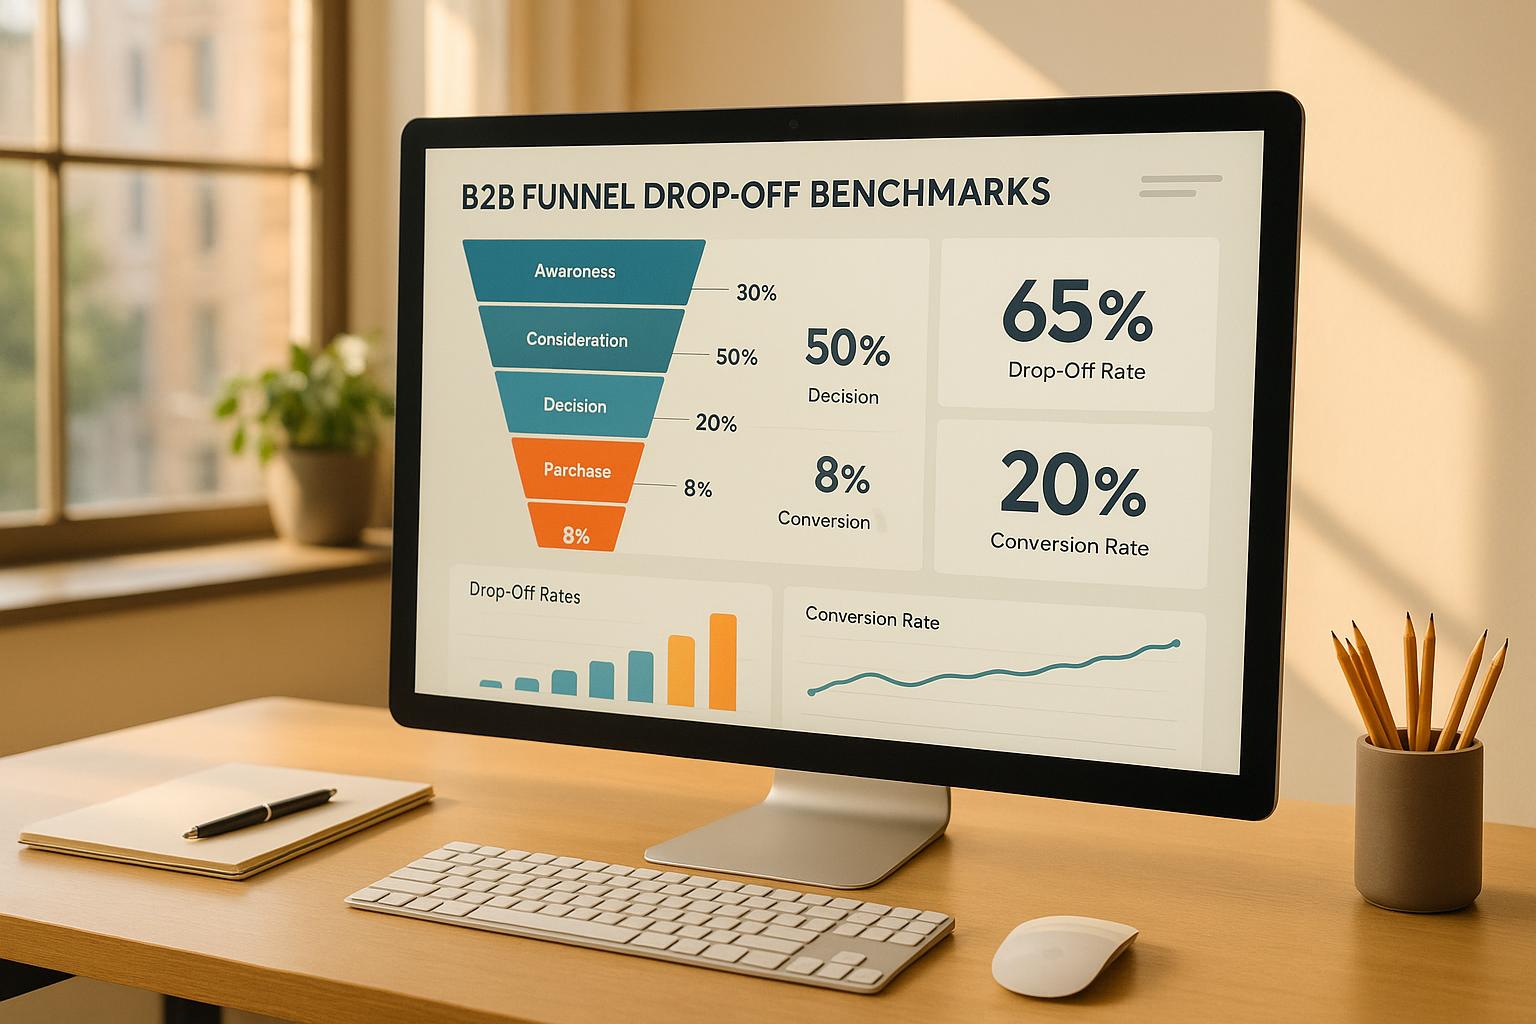
Marketing funnel metrics track how effectively your marketing moves potential customers through their journey - from discovering your brand to becoming loyal customers. Here's a quick breakdown:
-
Why Track Metrics?
Metrics help you make data-driven decisions, improve conversions, and optimize your marketing spend. For example, 84% of shoppers start product searches on external platforms - tracking helps you capture and convert them. -
Key Funnel Stages & Metrics:
- Awareness: Website traffic, social media reach, search rankings.
- Consideration: Engagement rates, time on site, content downloads.
- Conversion: Conversion rates, customer acquisition cost (CAC), cart abandonment.
- Retention: Customer lifetime value (CLV), repeat purchase rate, churn rate.
-
Tools to Track Metrics:
Use tools like Google Analytics (free), HubSpot ($45/month), or Mixpanel (free plan available) to monitor and analyze performance. -
Challenges:
Avoid vanity metrics, integrate data across platforms, and focus on actionable insights like CAC and CLV instead of flashy numbers.
Related video from YouTube
Metrics for Each Funnel Stage
Metrics for Awareness Stage
The awareness stage is all about getting noticed. It’s where you aim to attract potential customers and boost your brand’s visibility. The key metrics here help you gauge how well your efforts are working across digital platforms.
| Metric | What It Measures | Industry Benchmark |
|---|---|---|
| Website Traffic | Total visitors and unique pageviews | Monthly growth rate of 3-5% |
| Social Media Reach | Follower count and post reach | Platform-dependent engagement rate of 1-3% |
| Brand Impressions | Ad views and organic mentions | CPM between $6-$8 for display ads |
| Search Rankings | Position for target keywords | Top 3 positions for primary keywords |
Website traffic gives you an idea of how visible your brand is and how many leads you might be generating. Social media metrics highlight your audience growth and interaction levels. Brand impressions and search rankings show how well your brand is standing out and being discovered in the market.
Once you’ve caught their attention, the next challenge is keeping them interested during the consideration stage.
Metrics for Consideration Stage
During the consideration stage, you’ll want to measure how engaged and interested your prospects are. Keep an eye on metrics like email open rates, click-through rates, and content engagement (e.g., time spent on a page, bounce rates, and downloads). A steady increase in return visitor rates can signal growing interest in your brand.
Metrics for Conversion Stage
At this stage, it’s all about turning interest into action. Focus on the following key metrics:
- Customer Acquisition Cost (CAC): How much it costs to acquire a customer.
- Revenue per Conversion: The income generated per conversion.
- Cart Abandonment Rates: The percentage of users who leave without completing their purchase.
- Form Completion Rates: How many users fill out forms, such as for lead generation.
- Sales Qualified Leads (SQLs): Leads that are ready for the sales team to engage.
For context, the average e-commerce conversion rate typically falls between 2-3%. Use this as a benchmark to evaluate your performance.
Once conversions are secured, the focus shifts to keeping those customers around for long-term growth.
Metrics for Retention and Loyalty
Retention and loyalty metrics help you measure how well you’re maintaining relationships with your customers and encouraging repeat business.
| Metric | Purpose | Target Range |
|---|---|---|
| Customer Lifetime Value (CLV) | Customer value over time | 3x-5x CAC |
| Churn Rate | Customer loss percentage | Under 5% monthly |
| Net Promoter Score (NPS) | Customer satisfaction | Above 50 |
| Repeat Purchase Rate | Customer loyalty | 25-30% of total sales |
Improving retention metrics not only lowers the cost of acquiring new customers but also helps build a stronger, more sustainable business over time. Loyal customers often become your most reliable revenue source.
Tools and Methods for Tracking Metrics
Best Tools for Funnel Tracking
To measure your funnel effectively, you need the right tools. The best choice depends on your business's size, goals, and budget. Google Analytics is a go-to option for web analytics, offering integration with Google Ads and Search Console to provide insights into user behavior.
If you're looking for a more comprehensive solution, HubSpot's Marketing Hub covers everything from funnel tracking to CRM integration. For those focused on product analytics, Mixpanel stands out with its user behavior analysis and funnel visualization, even offering a free plan for basic needs.
| Tool | Key Features | Starting Price |
|---|---|---|
| Google Analytics | Website analytics, conversion tracking, audience insights | Free (Premium: $150k/year) |
| HubSpot | All-in-one marketing automation, CRM integration | $45/month |
| Mixpanel | User behavior analysis, funnel visualization | Free (Premium: $25/month) |
Once you've chosen your tools, it's crucial to set them up correctly to ensure reliable data collection.
How to Collect and Report Data
Accurate data starts with proper configuration. For example, in Google Analytics, you can set up conversion goals to monitor specific user actions. Custom dashboards can help you focus on the most important metrics at each stage of your funnel.
"Regular data analysis is essential for identifying and addressing funnel leaks."
To make your reporting effective, prioritize the following:
- Add tracking codes to all your marketing channels.
- Use consistent naming conventions for campaigns to avoid confusion.
- Automate reports on a weekly or monthly basis.
- Define clear KPIs for each funnel stage to measure success.
Once your data collection is in place, the next step is improving performance through testing.
Using A/B Testing to Improve Funnels
A/B testing can refine your funnel by comparing two versions of marketing elements to see which performs better. Focus on areas that have the most impact, like landing pages, email subject lines, or call-to-action buttons.
Here are some key tips for A/B testing:
- Test only one variable at a time to pinpoint what drives changes.
- Ensure your test results are statistically significant before drawing conclusions.
- Run tests for at least two weeks to gather reliable data.
- Keep a record of your results to inform future strategies.
sbb-itb-a84ebc4
Challenges in Measuring Metrics
Dealing with Data Silos
Data silos make it tough to measure your marketing funnel effectively. HubSpot's 2022 research reveals that 61% of marketers face difficulties integrating data from different tools. When teams rely on separate platforms for email campaigns, social media, and website analytics, understanding the full customer journey becomes nearly impossible.
The solution? Integrated marketing platforms. Tools like HubSpot provide a unified system where you can track everything - from a user's first website visit to their email interactions and eventual purchase - all in one place.
"The biggest challenge in measuring marketing performance is not having a single source of truth for data." - Rachel DiMicco, VP of Marketing at HubSpot
Avoiding Misinterpretation of Metrics
Misreading metrics can lead to poor decisions that hurt your marketing efforts. MarketingProfs reports that 44% of marketers struggle to connect metrics to their business goals. For instance, focusing only on page views without considering conversions, or prioritizing email open rates over actual sales, can lead you down the wrong path.
Steering Clear of Vanity Metrics
Vanity metrics may look great but often don't tell the full story about your business's success. Instead of getting distracted by flashy numbers like follower counts, focus on data that ties directly to revenue. Metrics worth tracking include:
- Customer Acquisition Cost (CAC)
- Customer Lifetime Value (CLV)
- Conversion Rate by Channel
- Revenue per Customer
The trick is to align your metrics with your business objectives. For example, if you're aiming to boost sales through content marketing, it’s more useful to track how many blog readers turn into customers than how many social shares your posts receive.
Conclusion
Summary of Key Points
Measuring a marketing funnel effectively means focusing on the metrics that matter most at each stage. From building awareness to driving retention, every phase requires attention to specific data points that influence business growth. Metrics like Customer Acquisition Cost (CAC), Customer Lifetime Value (CLV), and channel-specific conversion rates are essential for understanding revenue impact and improving customer retention.
By focusing on these critical metrics, businesses can make informed decisions to fine-tune their marketing funnel and achieve measurable improvements.
Next Steps for Businesses
To enhance your funnel's performance, consider these important steps:
- Set Up Reporting Systems: Review funnel metrics monthly to spot bottlenecks and identify areas for improvement.
- Test Regularly: Use A/B testing to see what changes lead to better results in your campaigns.
- Define Performance Benchmarks: Leverage tools like Google Analytics to monitor key metrics across funnel stages before implementing changes.
Explore marketing platforms that offer unified tracking across all customer interactions. Pay close attention to metrics like churn rate and CLV, using this data to improve how you attract and engage customers.
Tracking the right metrics is the foundation of better performance. Focus on the numbers that drive revenue and make consistent adjustments to create a reliable, high-performing funnel.
FAQs
How do you optimize a conversion funnel?
Improving a conversion funnel involves making data-backed decisions and constantly refining each stage. With 84% of shoppers starting their product searches on external platforms, it’s clear that optimizing every aspect of the funnel is crucial.
1. Use the AIDA Model
Organize your efforts using the AIDA framework:
- Awareness: Craft content that grabs attention.
- Interest: Develop materials that keep your audience engaged.
- Desire: Highlight benefits that make your offering irresistible.
- Action: Make conversion paths simple and include strong calls-to-action.
Once your funnel follows the AIDA structure, focus on tracking and improving its performance through relevant metrics.
2. Track Key Metrics
Analyze performance metrics for each stage of the funnel to pinpoint areas that need improvement. This allows you to take targeted actions to boost results.
3. Optimize Across Multiple Channels
Provide a consistent and smooth experience across all customer touchpoints by:
- Improving content visibility with SEO.
- Expanding your reach through social media ads.
- Enhancing external platforms where customers first interact with your brand.
- Combining efforts, like pairing email campaigns with retargeting ads, to re-engage potential buyers.


